1.Network Visualization Over Time
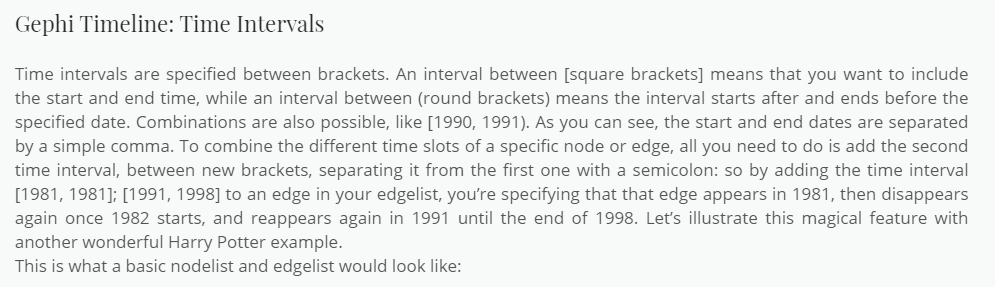
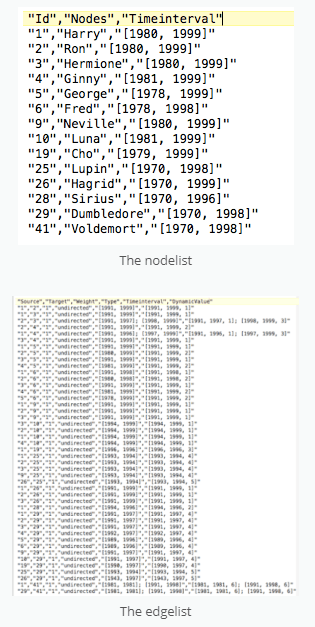
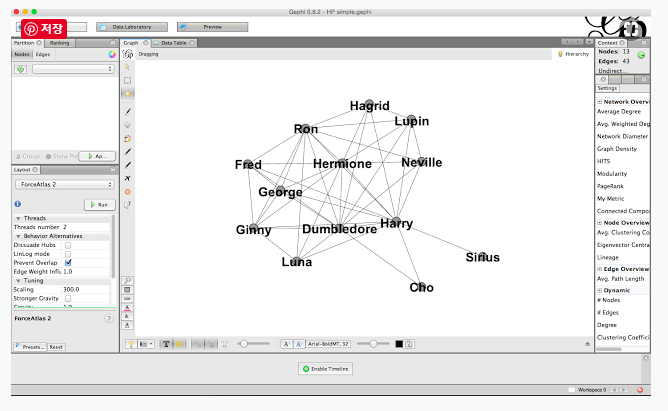
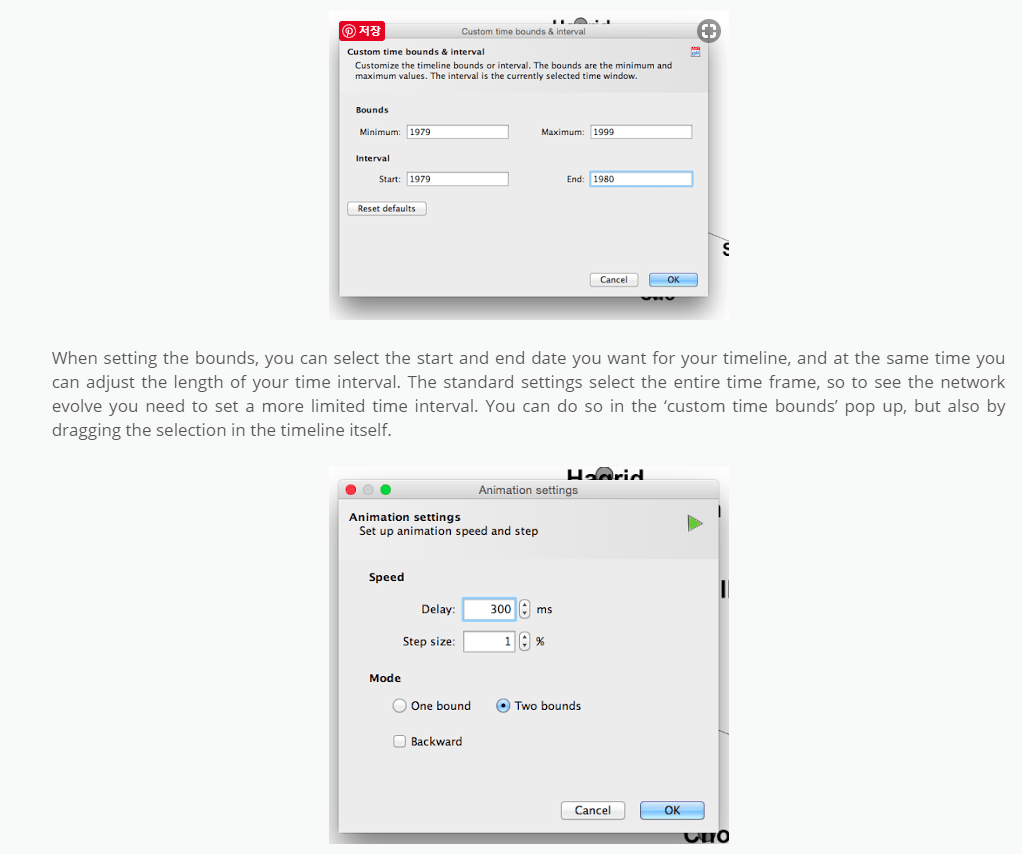
Previously, I learned how to visualize networks that change over time using R programming. This time, I realized that this is possible in a program called Gephi that I have used frequently. I can use this feature to create animations and give the time intervals I want.
Reference:
http://historicaldataninjas.com/gephi-timeline-tutorial/
http://historicaldataninjas.com/gephi-timeline-basics/
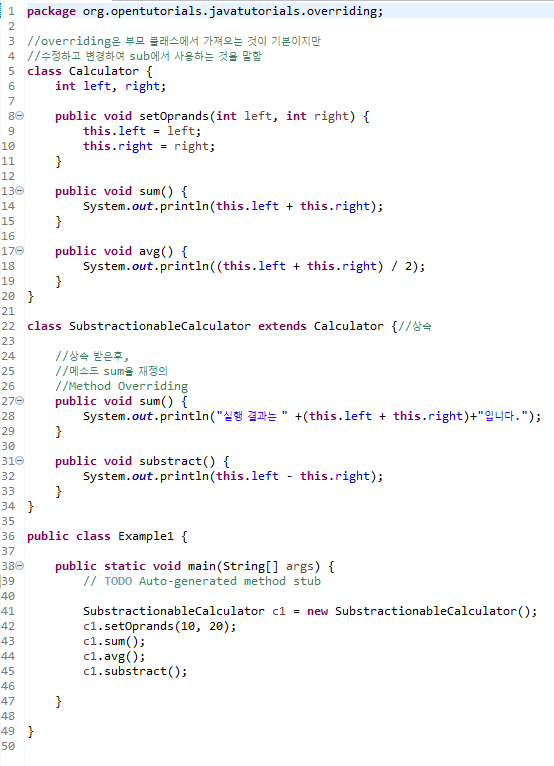
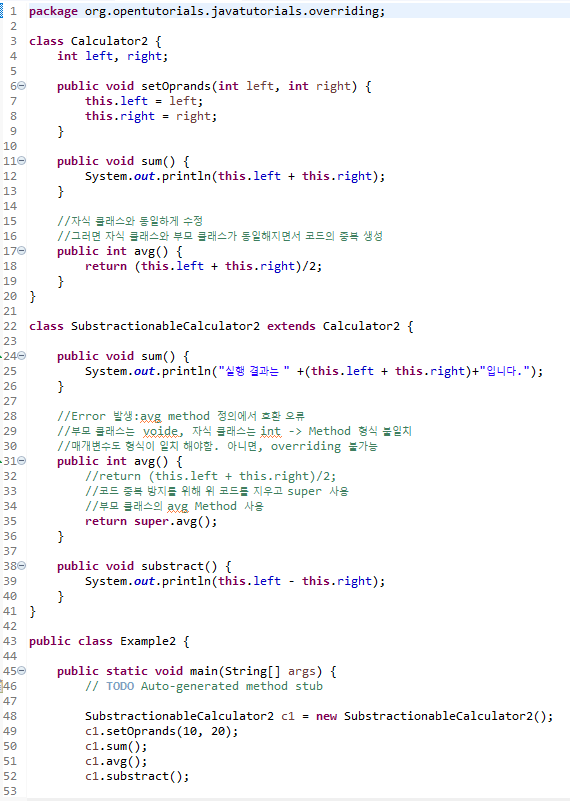
2. Java Study
*Code
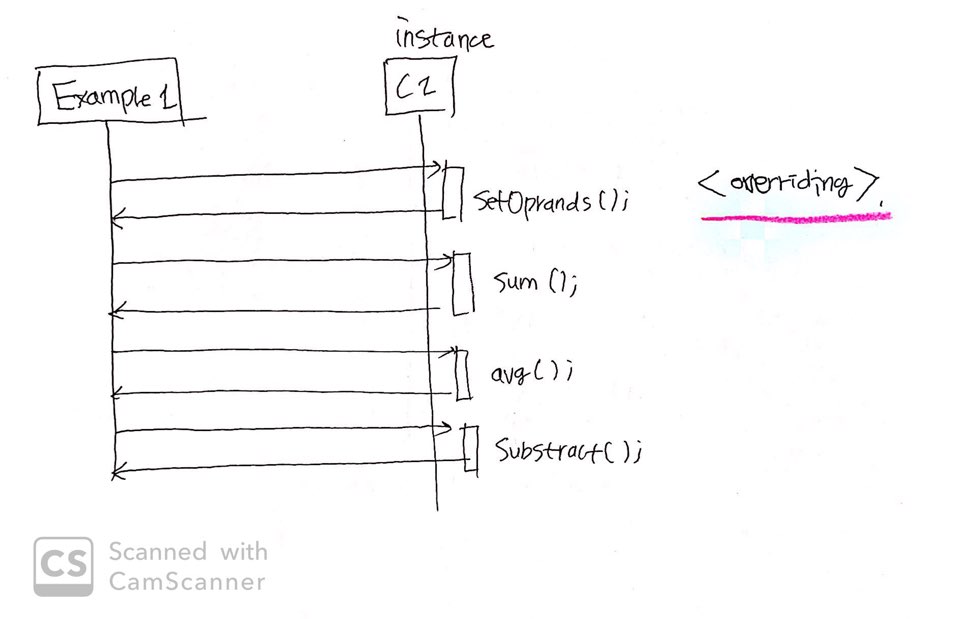
*UML
*Link
