1.Recruiting
First of all, I wrote a new recruit by referring to the articles written on the KAIST bulletin board. Most of them pay 100% of the participation fee, not the prizes, so I wrote 10000 won, which you can judge.
Google Survey : https://forms.gle/HowUpyNgdQ14QPhy5
2. Visualization
I am looking for ways to visualize a network that changes over time. First, They created a slide bar through R programming to see how the network changed over time.
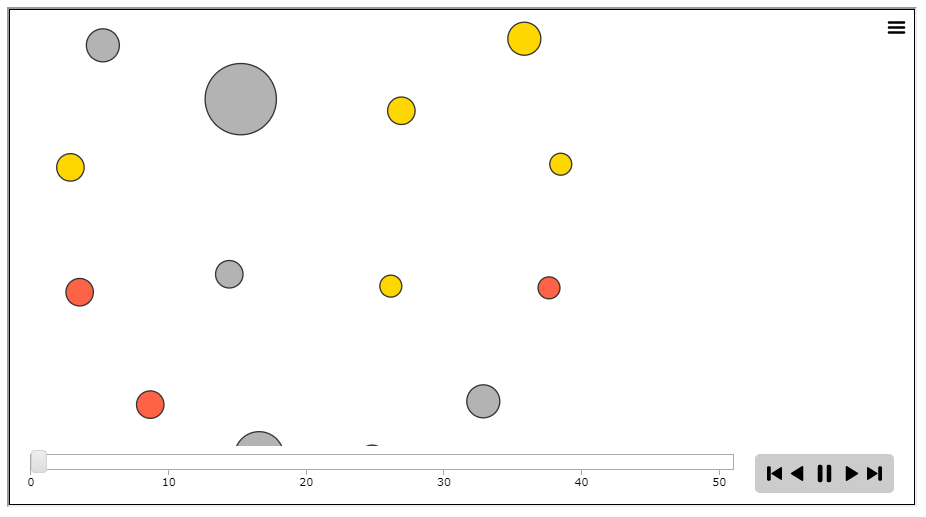
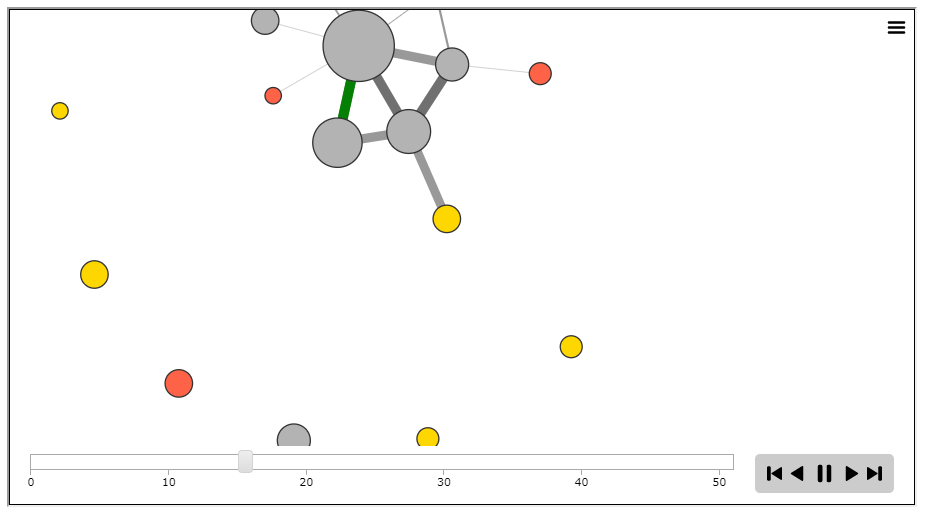
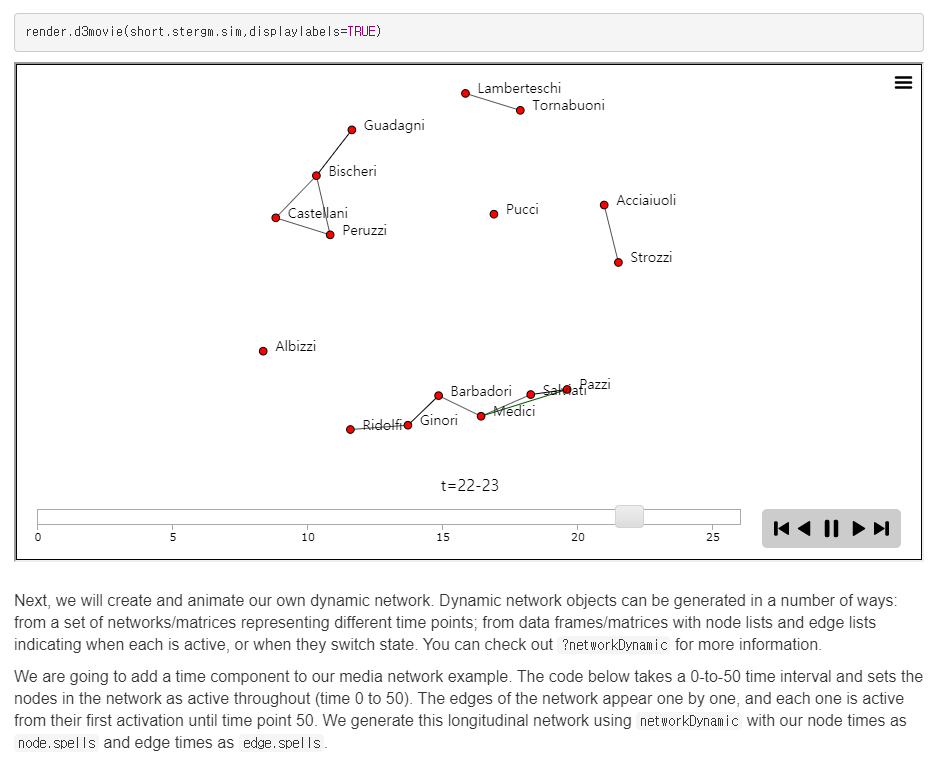
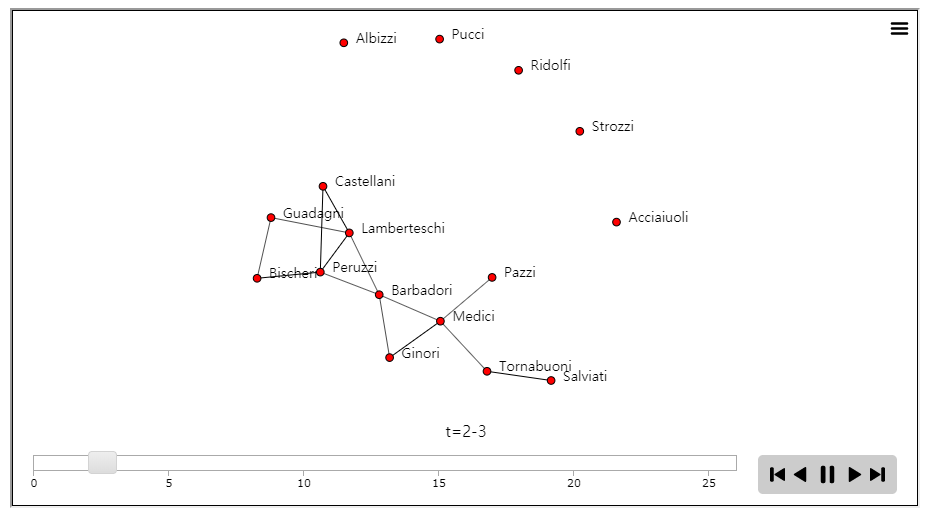
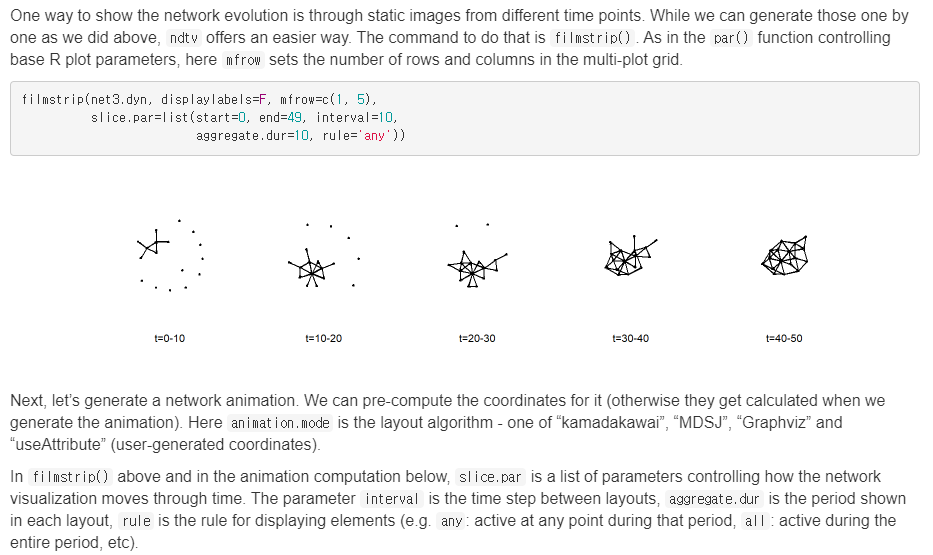
Reference : https://kateto.net/network-visualization
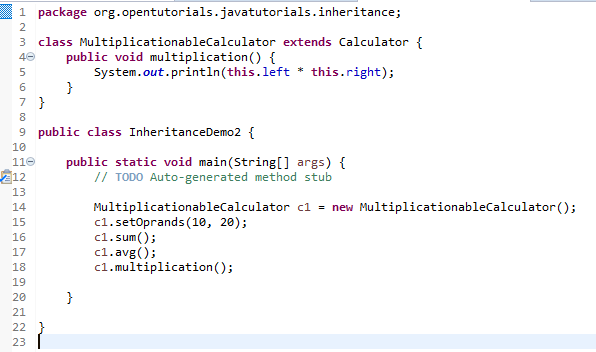
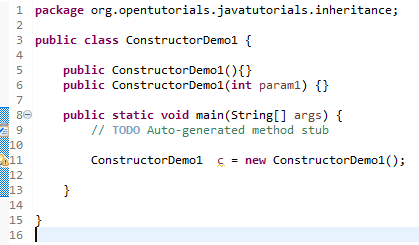
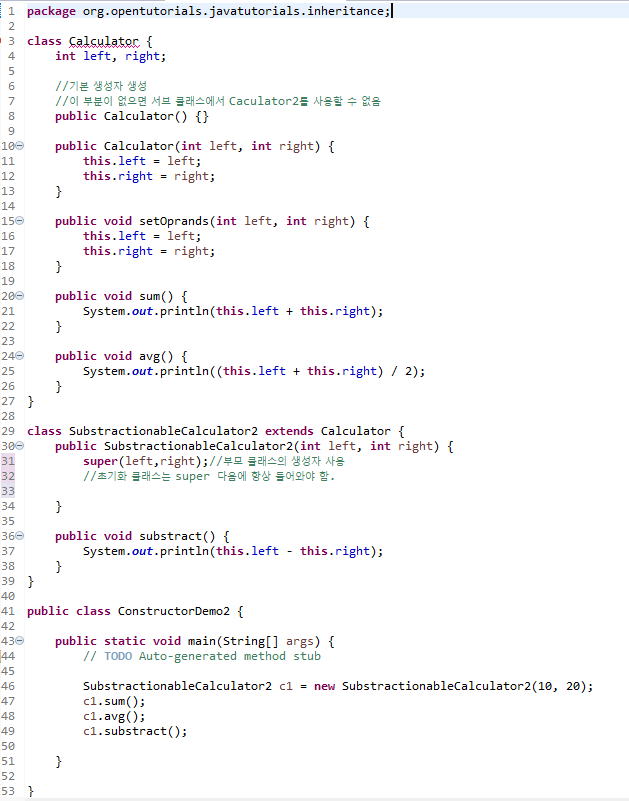
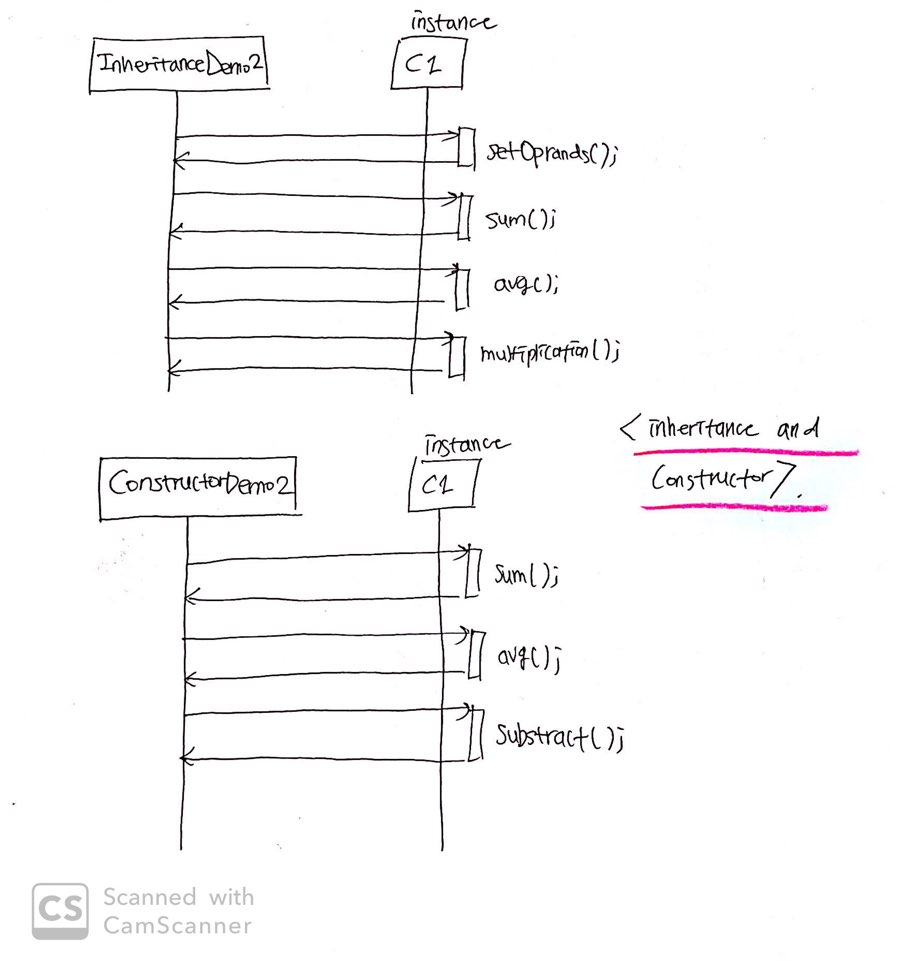
3. Java Study
*Code
*UML
*Link
