1) SNS Data
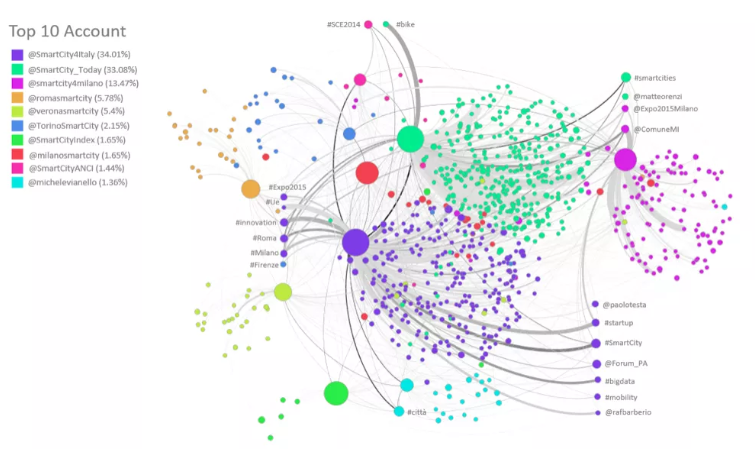
Social network analysis : “Smart cities”
Reference : https://chorally.com/learn-impact-smartcity-using-social-networks-analysis/
Simplify version of Social Network Graph of Smart City. The nodes represent Twitter @account or #hashtag. The size of nodes are proportional of the level of Node Betweenness Centrality, colors refer the cluster membership. Black edges have greater ability to link several clusters and the size is proportional to the degree of interactions between two nodes. The legend shows the main nodes for the ten largest clusters classified using the Chinese Whispers Algorithm.
2) GPS Data
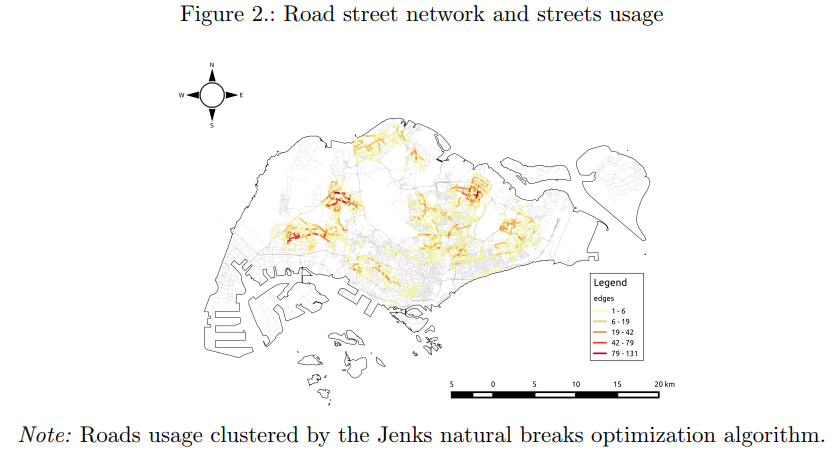
Short-distance commuters in the smart city
Reference : https://arxiv.org/pdf/1902.08028.pdf